Ask Your Devices: Zafron's MCP Server and AI-Built Dashboards

Your AI assistant can now read your Zafron devices, answer questions about their data, and build a dashboard for you from a single sentence. This release introduces the Zafron MCP server and generative dashboards.
Zafron, Inside Your AI Assistant
Zafron now speaks the Model Context Protocol (MCP), the open standard AI assistants use to connect to outside tools. Add Zafron once, sign in with your Zafron account, and your assistant can work with your fleet directly:
- "What's the latest reading from the greenhouse sensor?"
- "Did the freezer miss any uplinks last night?"
- "What was the average soil moisture per day this week?"
Behind those questions, the assistant has tools for the things you do in the app today:
- Devices and readings: list devices, get the latest value per channel, and pull raw history for several channels at once.
- Device health: an overview of every channel a device has ever reported, its inferred uplink interval, expected versus received uplinks, and the exact gaps.
- Statistics: averages, min/max and standard deviation per hour, day or week, computed on our side so the numbers are exact rather than estimated by the model.
- Configuration: profiles and decoders (including testing a payload against a decoder before you save it), HTTP sources, and rules.
Connecting
The server lives at:
https://api.zafron.dev/mcp
The Dashboards page in the app has step-by-step setup for Claude, Claude Code, ChatGPT, Grok and Muse, plus any other MCP client that supports remote servers over streamable HTTP. When your client asks, sign in with your Zafron account and use the OAuth client ID zafron-mcp. In Claude Code it's one command:
claude mcp add --transport http --client-id zafron-mcp zafron https://api.zafron.dev/mcp
You approve two permissions: mcp:read lets the assistant read your devices and data, and mcp:dashboards lets it save dashboards to your account. Grant only the first if you want an assistant that can look but not change anything.
Dashboards, Built From a Sentence
Describe the dashboard you want in chat:
"Build a dashboard for the greenhouse with temperature and humidity over the last week."
Your assistant designs it, checks it against your real devices and channels, and saves it. It shows up on the new Dashboards page right away.
Because the assistant writes the whole page, a dashboard isn't limited to a fixed set of widgets. It can group sensors the way you think about them, compute a derived value like a livestock heat index, or flag conditions worth attention, and lay it all out however suits the job. You can keep iterating in the same conversation: "add a battery gauge", "make the rain chart daily totals".
A Few We've Built
Each of these came out of a short conversation, and no two look alike.
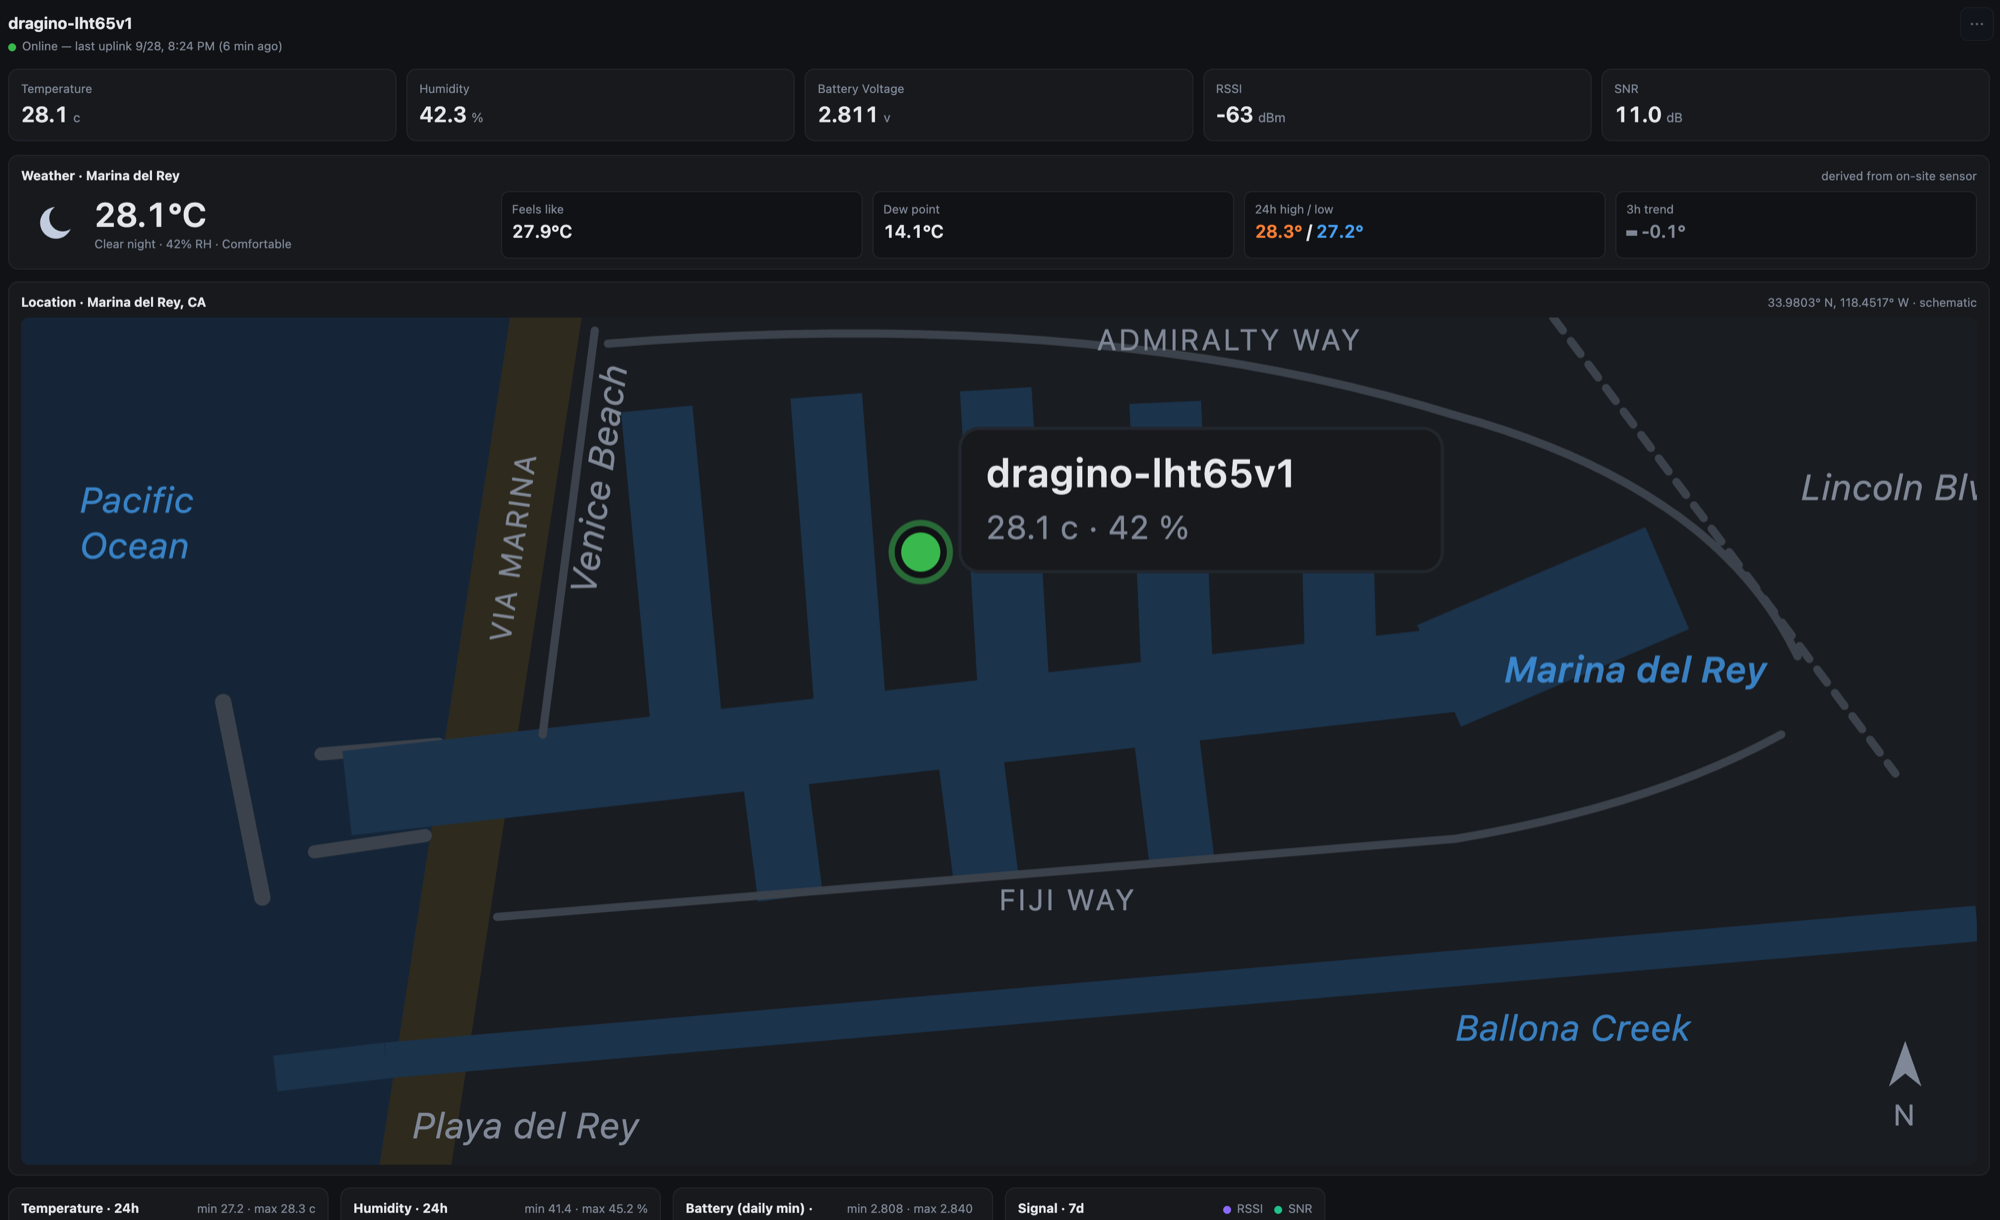
A single LHT65 with its latest readings, a weather summary worked out from the on-site sensor, and a map of where it's installed.
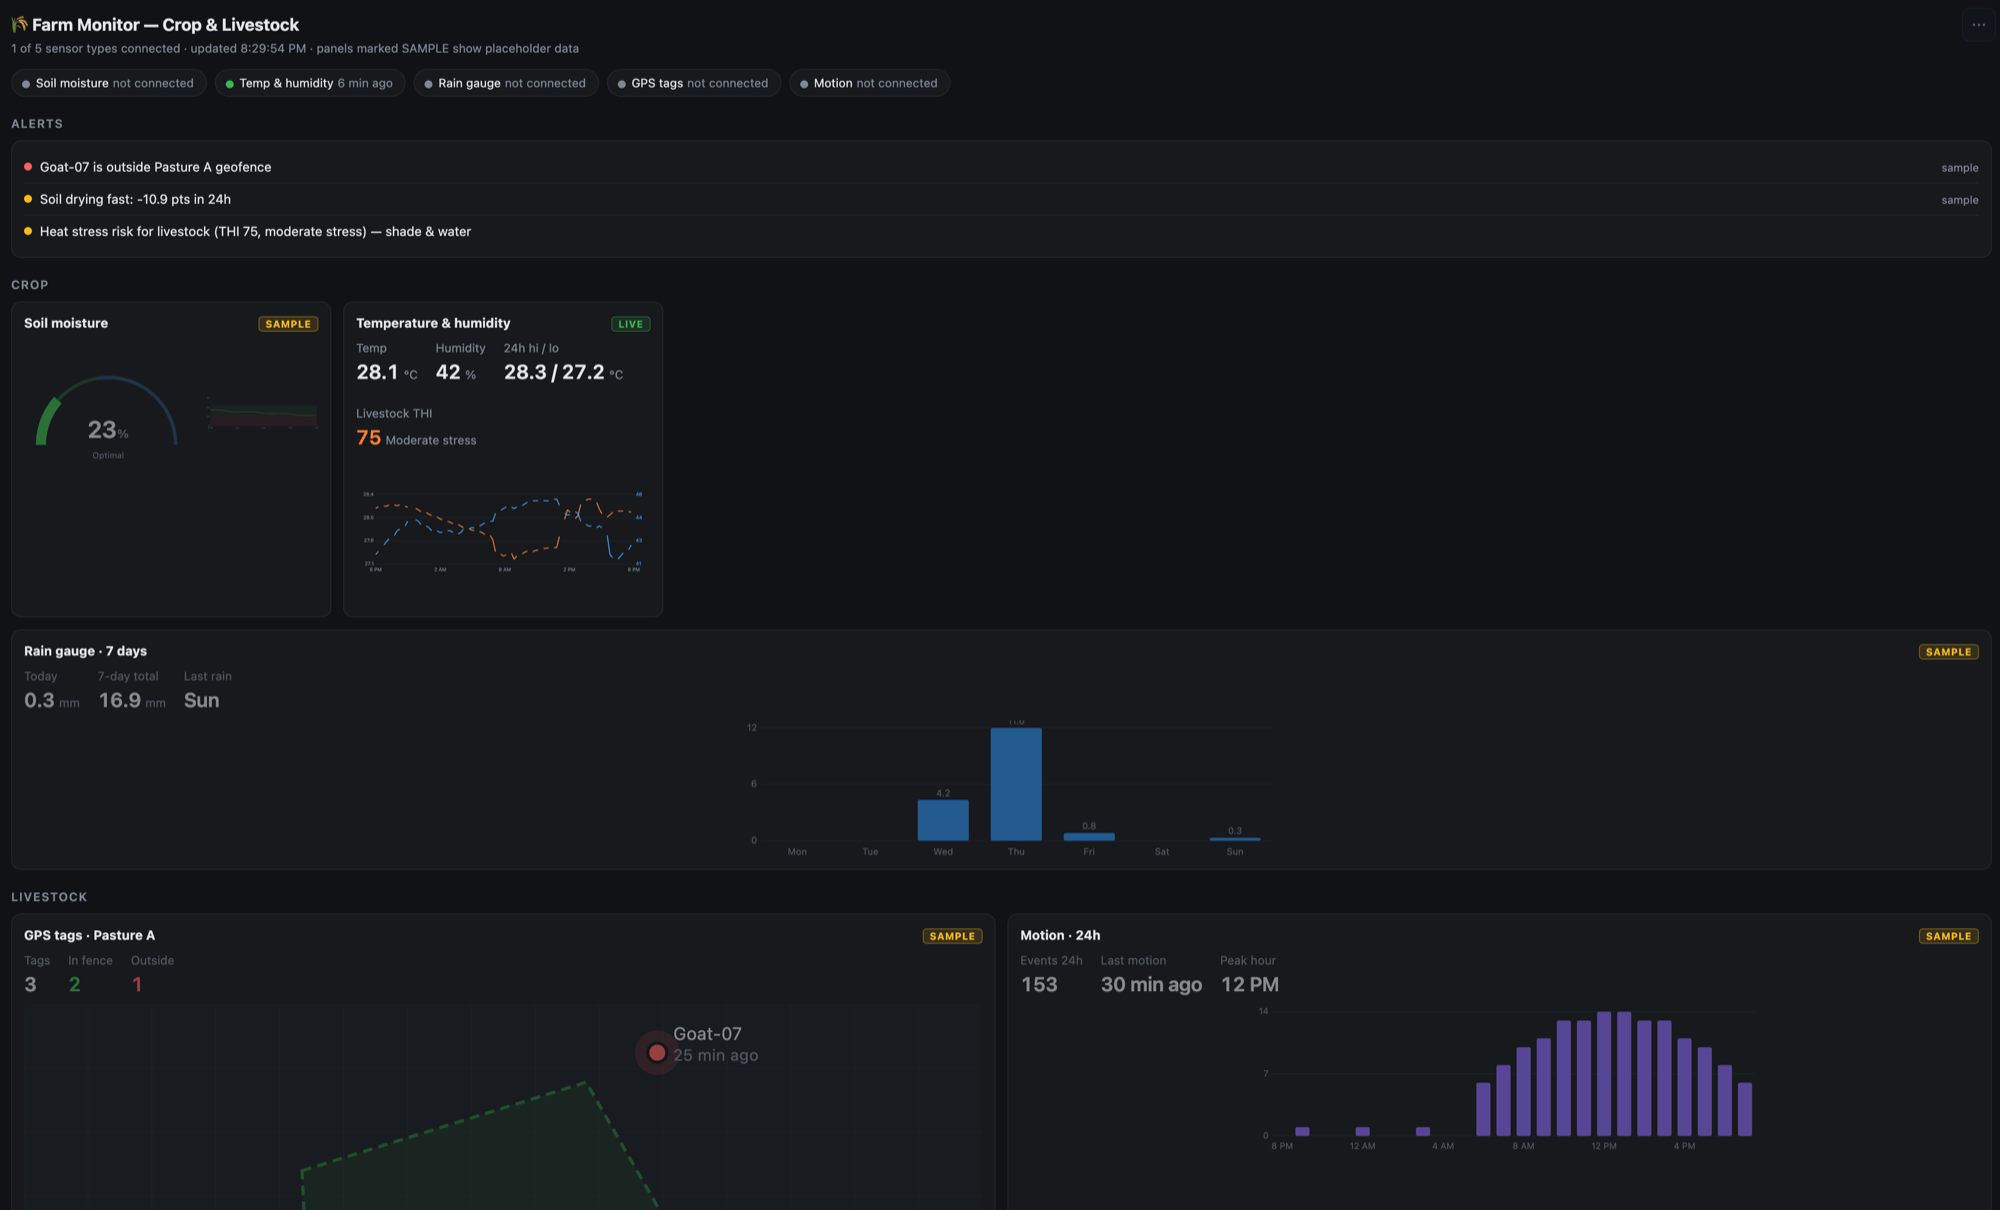
A farm monitor for crops and livestock. Live panels sit next to panels marked SAMPLE, so the layout is ready before every sensor is installed.
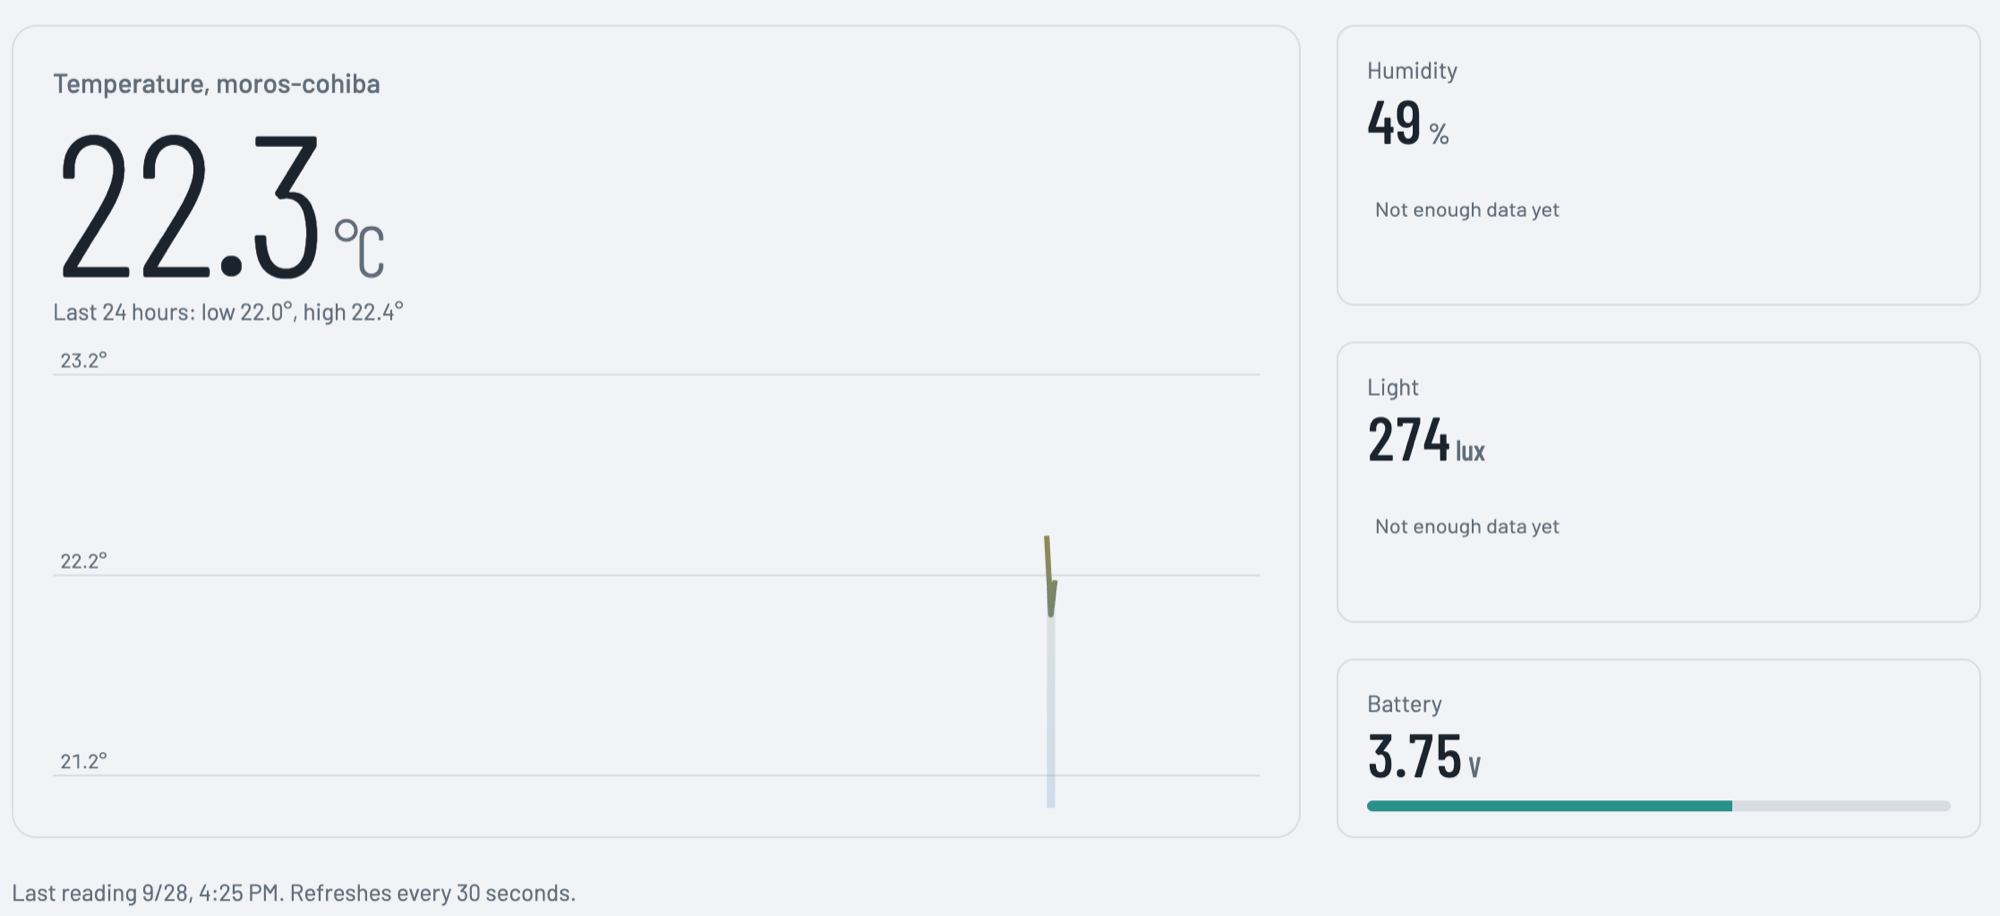
Room climate at a glance: one large number, with humidity, light and battery on the side.
More examples are on the Generative Dashboards page.
What you get when you open one:
- Each dashboard opens in its own tab as a clean, full-screen page with no app navigation around it.
- A small control in the corner changes the time range (1 hour to 90 days) and refreshes the data. It stays out of the way until you need it.
- Data comes straight from your account: latest values, time series with automatic bucketing, and uplink coverage.
Start with an example. If you open the Dashboards page before you've created any dashboards, Zafron builds one for you from a device that has reported data, so you can see what's possible before you write a prompt.
Built to Be Safe
A dashboard is code written by an AI, so we treat it that way:
- Dashboards run in a sandboxed frame on a separate domain, isolated from your Zafron session. The dashboard can't see your login or act on your behalf.
- A strict content security policy blocks the page from calling out to the internet. It can only ask Zafron for the specific device data it declared when it was saved.
- Every dashboard is validated before it's saved. A device you don't own or anything outside the rules is rejected, and a channel that has never reported gets flagged, so your assistant can fix the problem before you ever see it.
Each account can keep up to 50 dashboards, each drawing on up to 6 devices.
Plans
The MCP server is available on every plan. On the Free plan, your assistant can look back over the last 24 hours of readings. Paid plans can reach as far back as your data retention allows and unlock the statistics tool for daily and weekly trends.
A New Way to Add Devices
Adding a device is now its own page, a step-by-step flow instead of a pop-up. For LoRaWAN, it starts with the new device catalog: pick your sensor model and Zafron sets up the right decoder, channels and units for you. There's no codec to paste and no profile to configure.
The catalog launches with three Dragino sensors:
- LHT65: temperature and humidity
- LDS02: door and window open/close, with open count and duration
- LSE01: soil moisture, temperature and conductivity
Any other LoRaWAN device still works through Custom (CayenneLPP). Once a device is added, its page shows a setup checklist until the first uplink arrives, so you know exactly what's left to do. The full list, with the channels and units each model reports, is on the Supported devices page, and your AI assistant can browse the catalog too.
Dark Mode
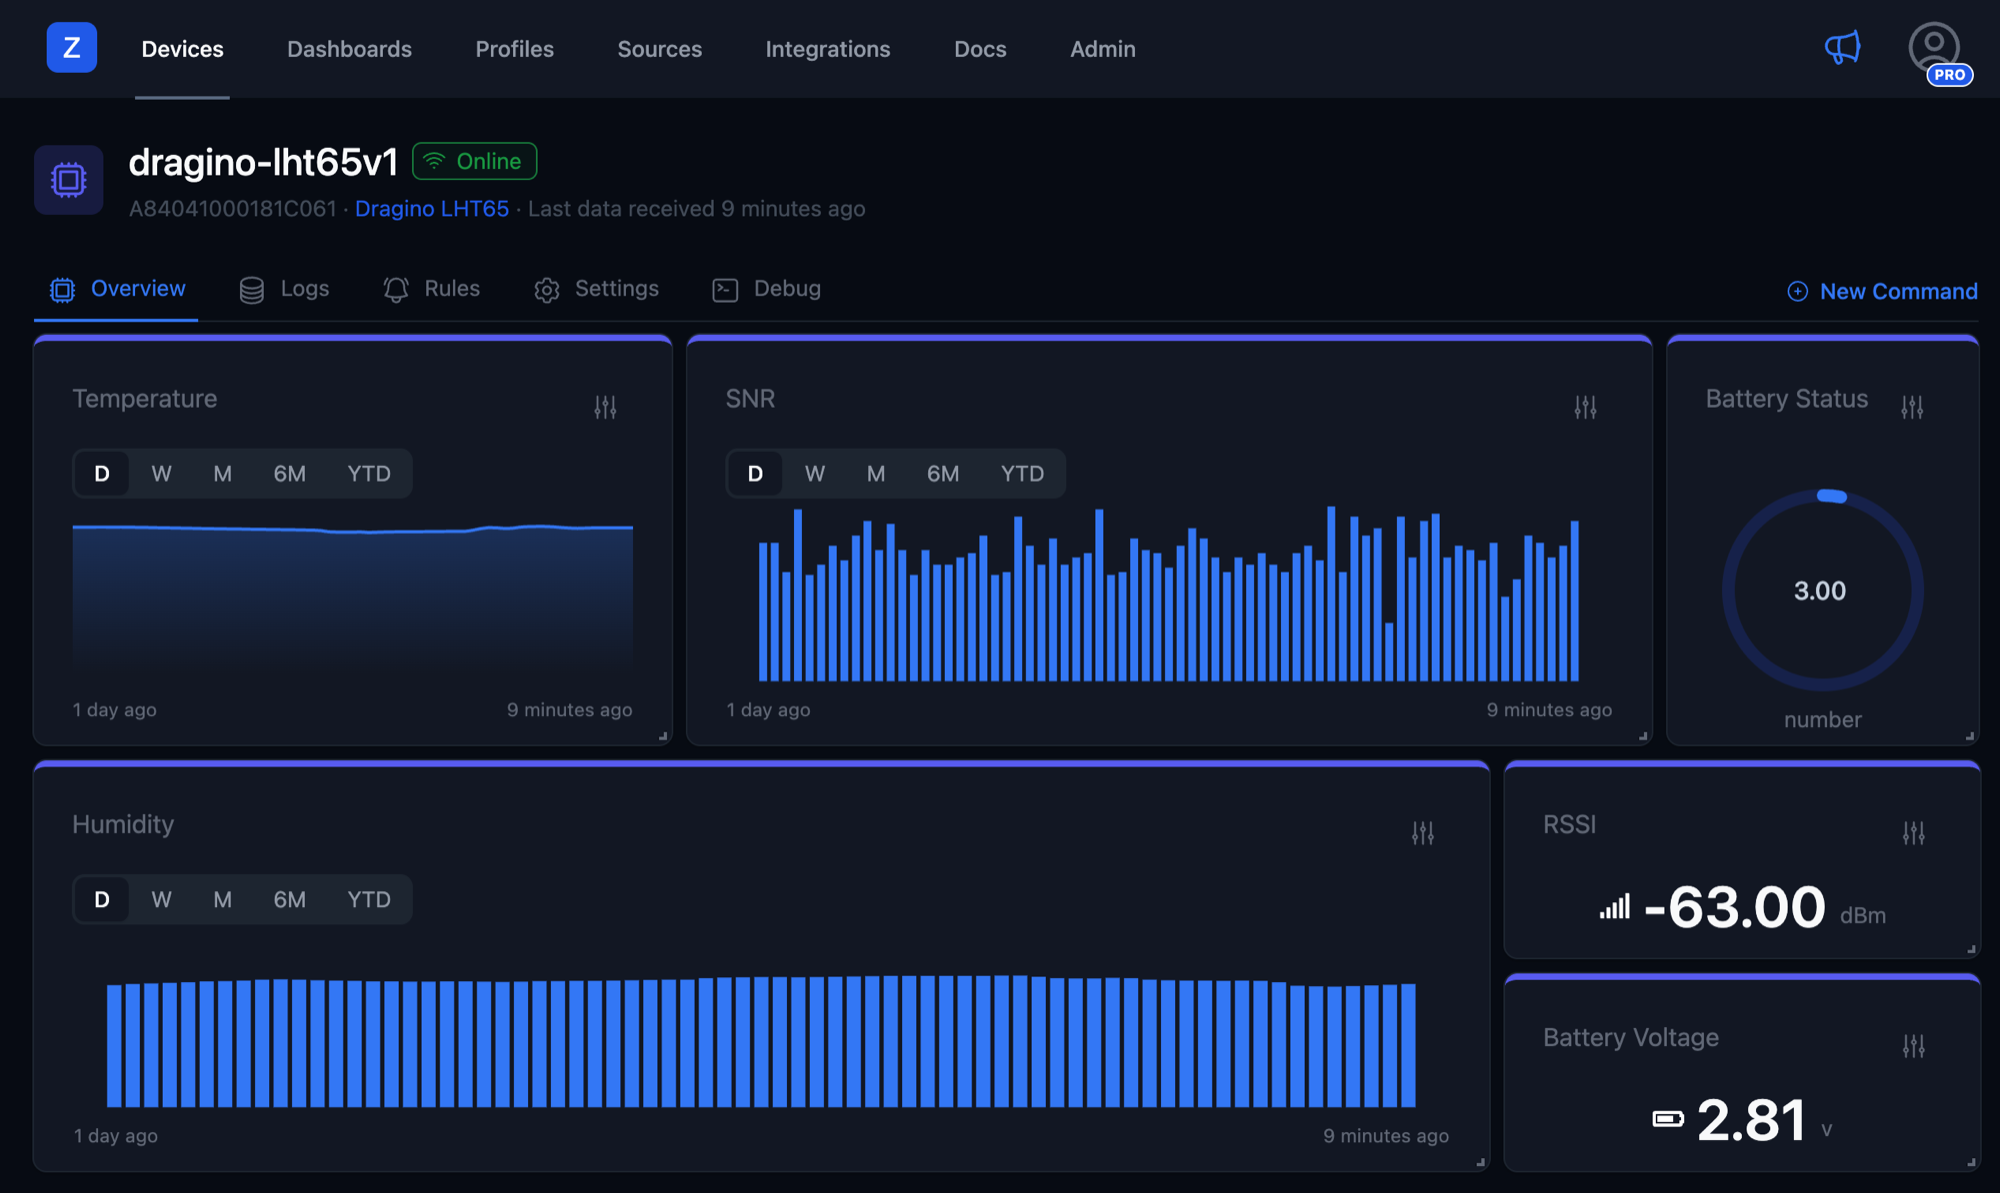
Zafron now has a dark theme across the app, from the device list and charts to profiles, sources, maps and the code editor. Choose Light, Dark or System from the user menu; System follows your operating system and switches with it. The login and sign-up pages have a theme toggle too.
Also in This Release
- Device attributes: attach your own typed metadata to a device (text, numbers, true/false, dates), such as a location name, install date or firmware version, from the device's Settings tab. Your AI assistant can read it too.
- Soil conductivity: a new capability type measured in µS/cm.
- Zero readings kept: a sensor reporting exactly
0over MQTT is no longer dropped. - Billing: free accounts are clearly labeled "Free Plan", and canceled subscriptions now return to the free plan correctly.
Connect your assistant from the Dashboards page and tell us what you build. We'd love to see it.