Describe the dashboard. Your assistant builds it.
No widget pickers, no drag and drop. Tell your AI assistant what you want to see, and a live dashboard appears in Zafron, built around your devices and your data.
"Make a farm dashboard with temperature, humidity and battery for my LHT65."
Moments later, Farm Monitor is on your Dashboards page, showing live readings and refreshing on its own.
How it works
- Connect your assistant. Add Zafron to Claude, ChatGPT or another MCP client. Here's how →
- Ask in plain words. Name the devices and readings you care about. Your assistant chooses the charts and layout.
- It keeps itself current. Saved dashboards update on their own schedule. To change one, just ask.
When you sign in, allow dashboards access as well as read access. Without it, your assistant can design a dashboard but can't save it.
Sample dashboards
Each of these was built from a short conversation. No two look alike, because each one is designed around the request.
Device overview with weather and location
"Build a dashboard for my LHT65 with its latest readings, local weather and where it's installed."
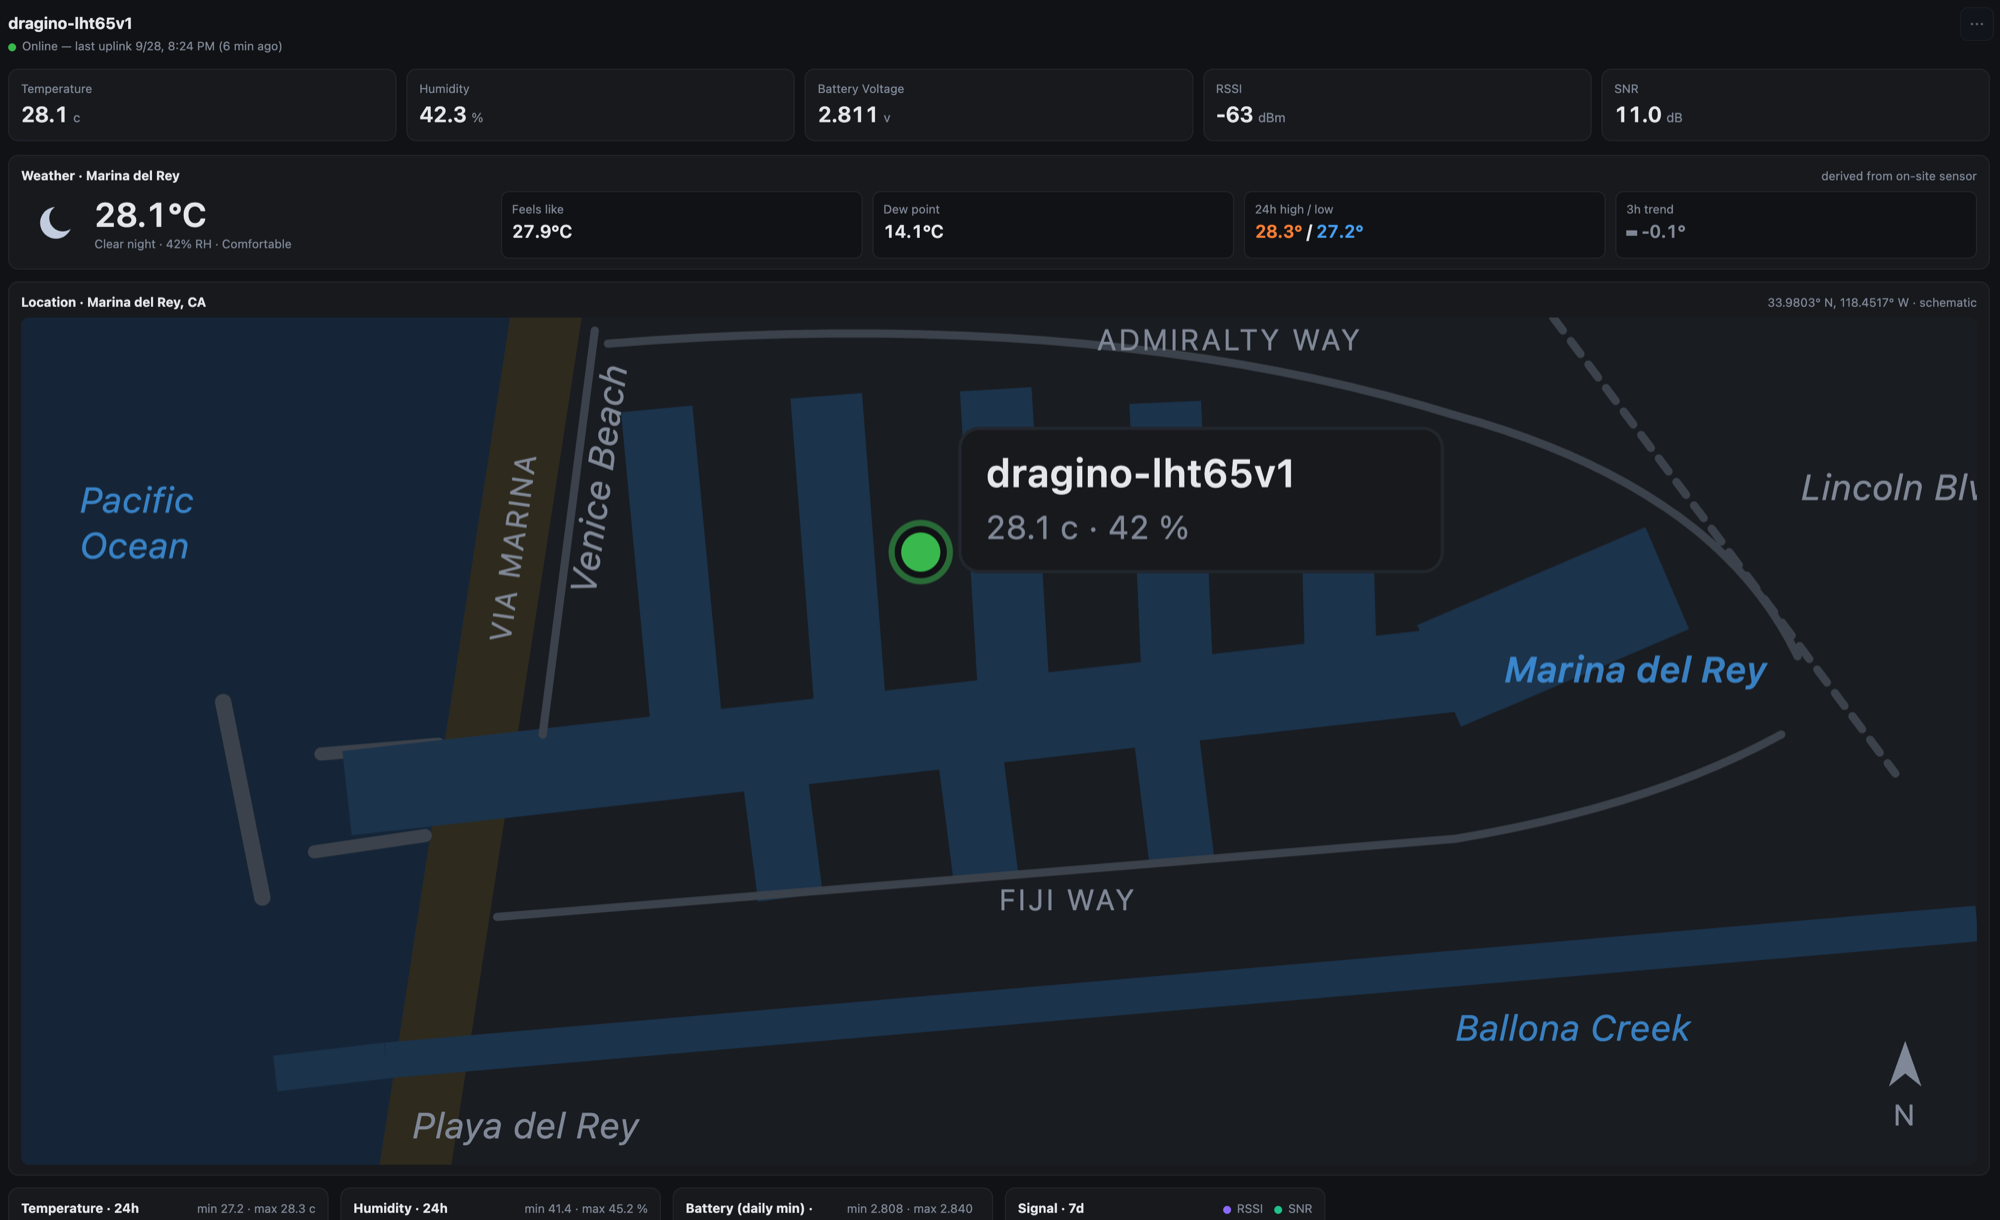
Reading cards across the top, a weather summary worked out from the on-site sensor, and a map of where the device sits.
Farm monitor
"Make a farm dashboard for crops and livestock. Use sample data for the sensors I haven't connected yet."
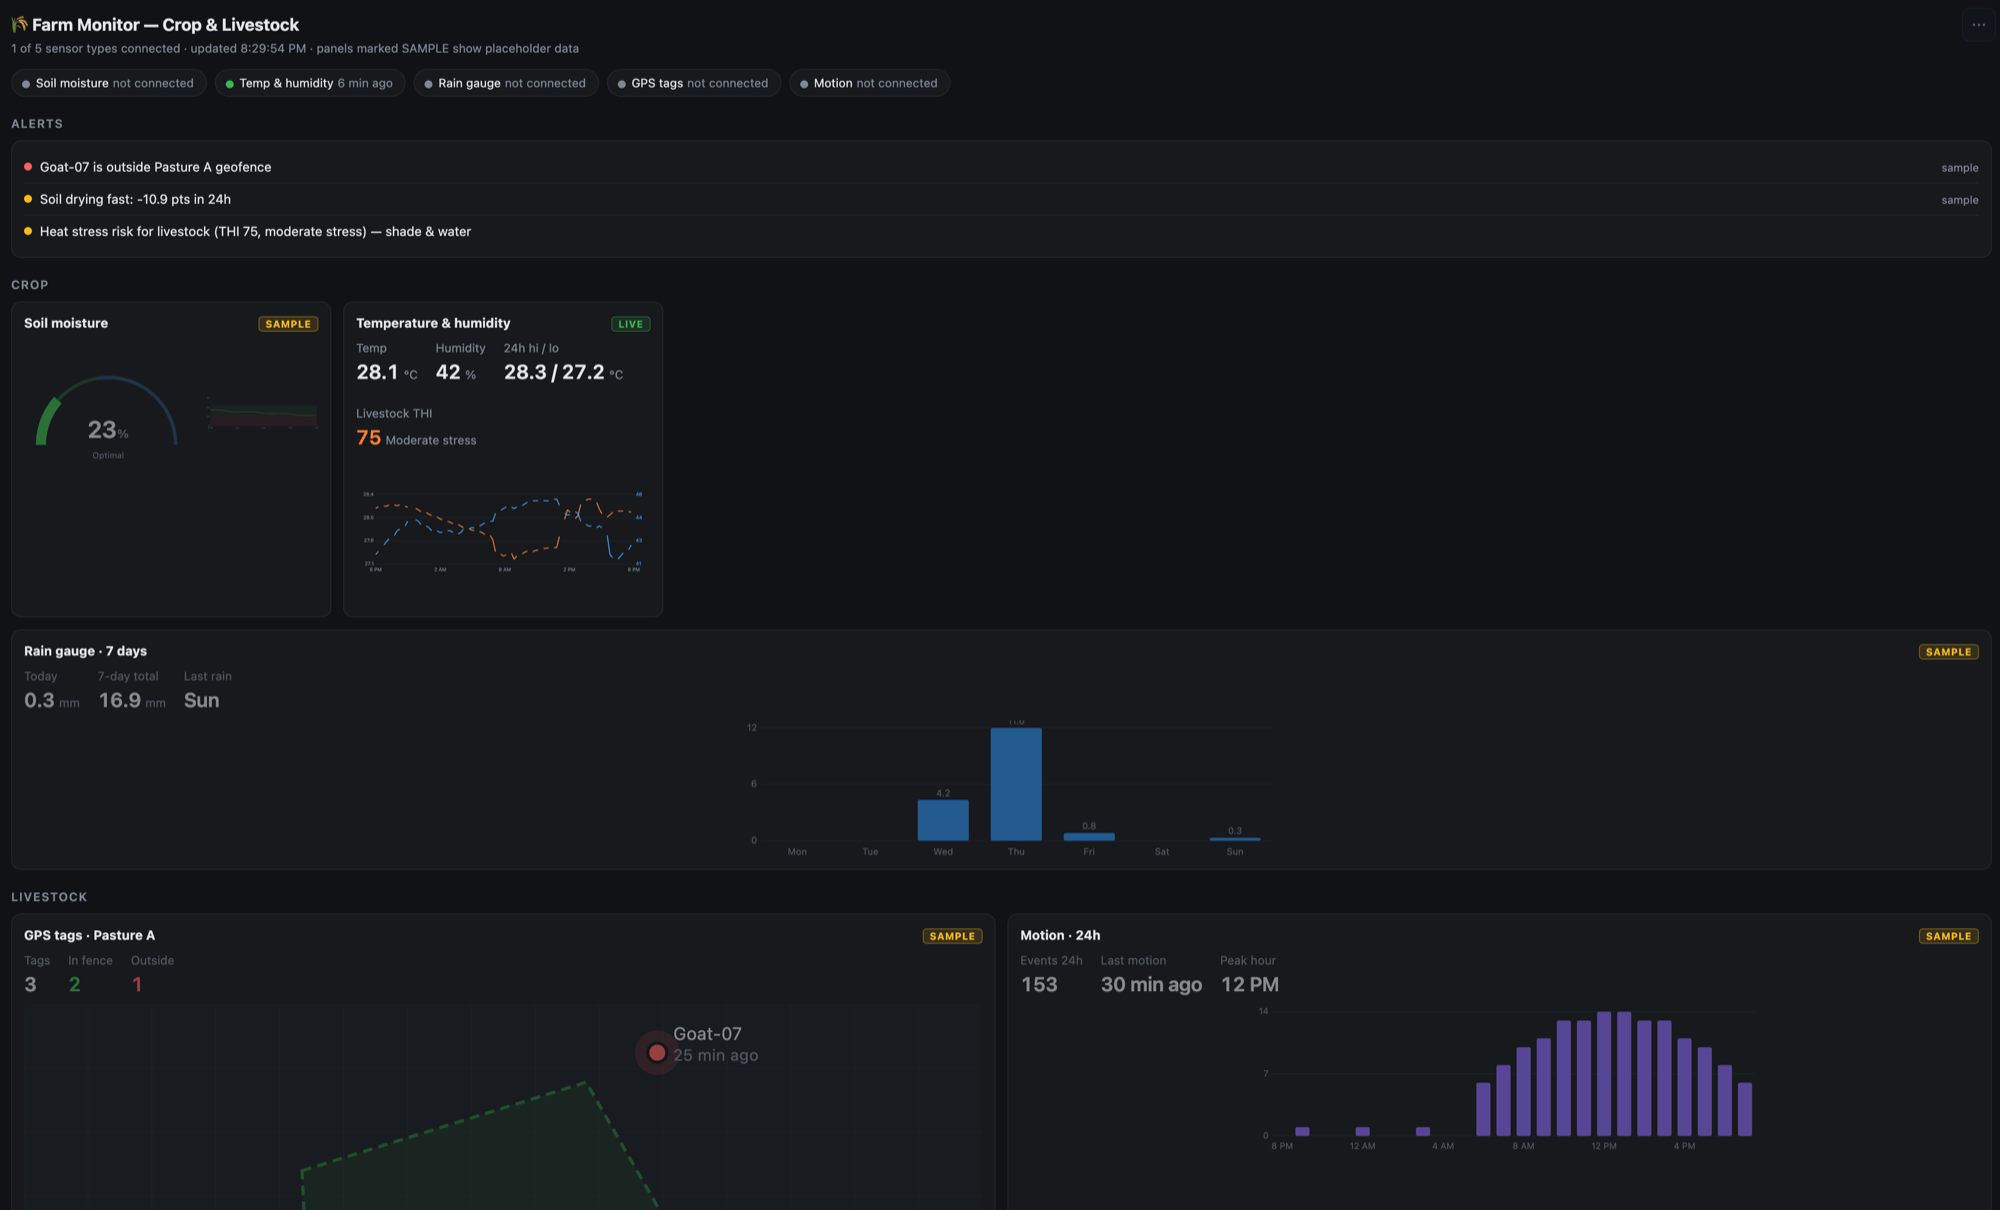
Live panels sit next to panels marked SAMPLE, so you can plan the full layout before every sensor is installed.
Room climate at a glance
"Show the temperature big, with humidity, light and battery on the side. Keep it light and simple."
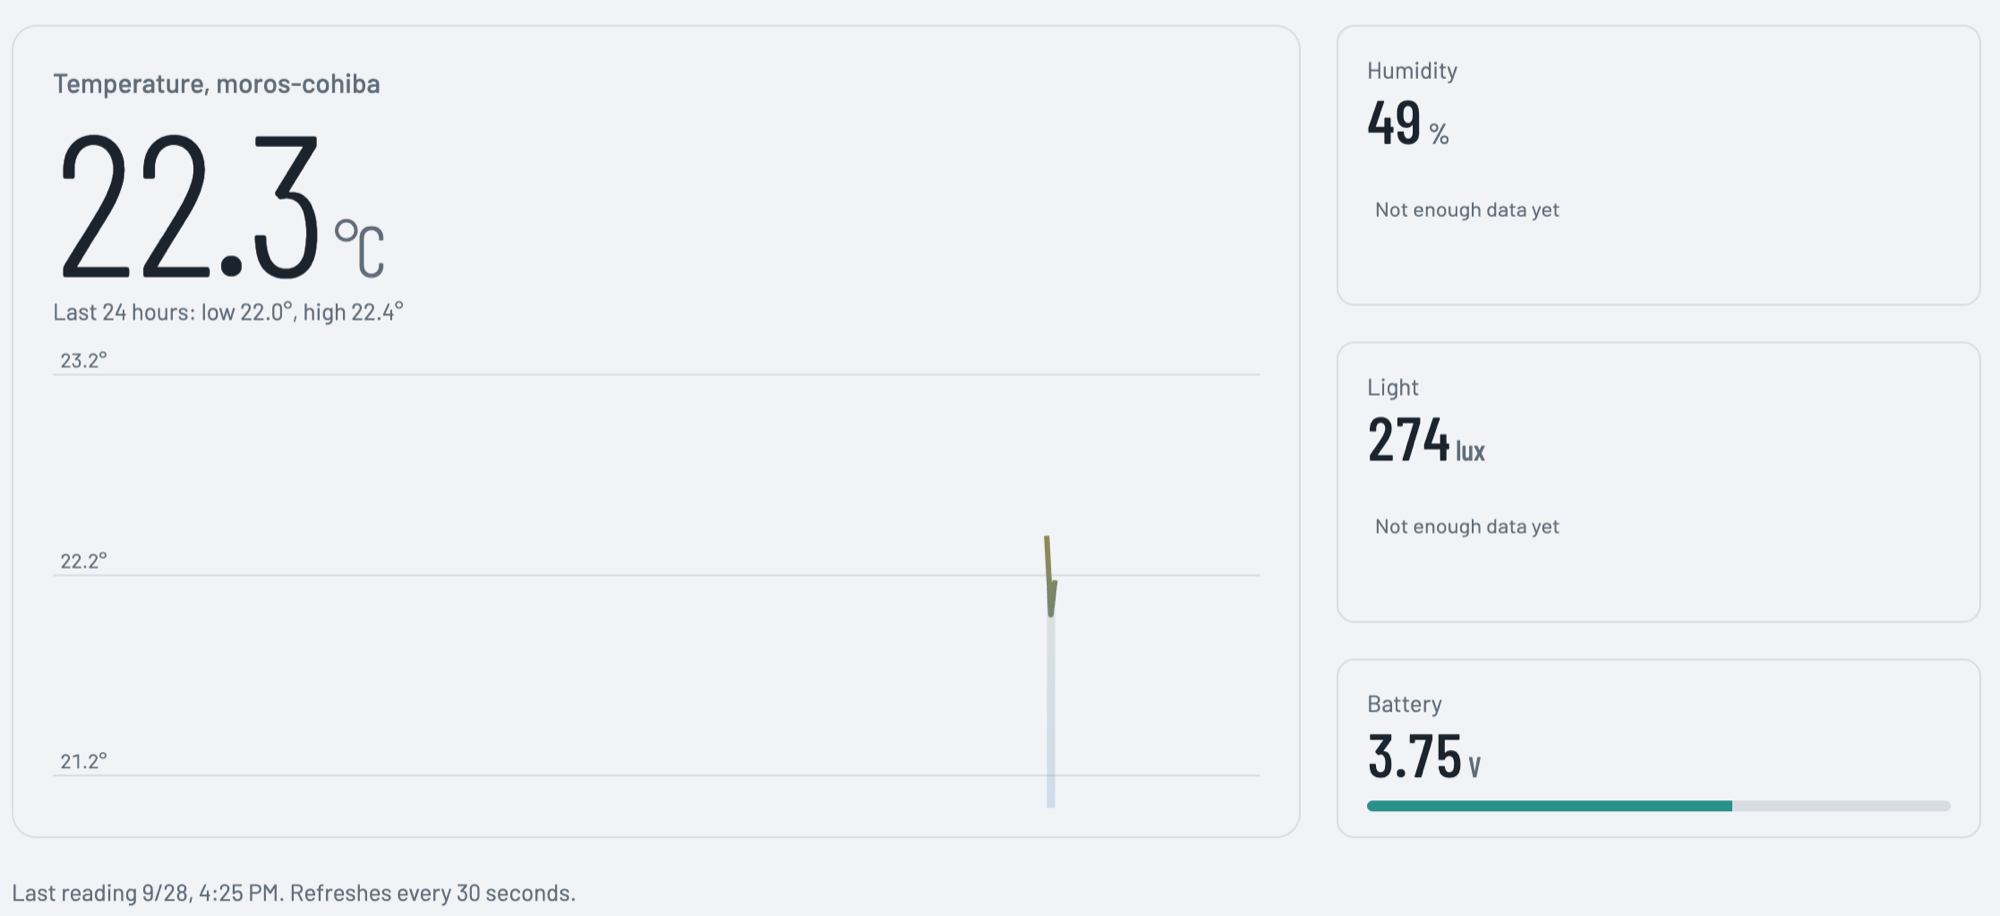
One large number you can read from across the room, with the rest kept out of the way.
Ideas to try
- "Build a dashboard for my weather station with temperature and humidity over the last week."
- "Compare the three soil sensors in the north field."
- "Show me when the cold room went above 5 °C today."
- "Add an uptime strip so I can see missed uplinks."
- "Add a battery card to my latest dashboard."
- "Refresh my greenhouse dashboard every minute."
Why it's different
- Built for your data. Your assistant looks at what each device actually reports before it designs anything, so charts match the channels your devices really send.
- Change it in conversation. "Make the chart bigger" or "add humidity" updates the same dashboard. There's no need to start over.
- Checked before it's saved. Zafron checks every dashboard before it's stored and rejects any with errors.
- Safe by design. Dashboards run in a locked-down sandbox. Each one can read only the devices it was built for and can't send your data anywhere.
- Honest about bad data. Ask it to ignore impossible readings, such as a sensor error value, and they're left out of the chart and counted, not plotted.
Tips for great results
- Be specific. "Temperature and humidity for the barn sensor over 7 days" works better than "a dashboard for my sensor."
- Say what normal looks like. "Ignore anything outside −40 to 85 °C" keeps one faulty reading from wrecking the scale.
- Build in steps. Start simple, then ask for more: another card, a longer range, a different color.
Each account can have up to 50 dashboards, and each dashboard can show up to 6 devices.